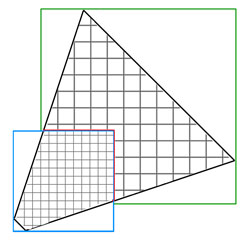
Cascaded Perspective Variance Shadow Mapping

Perhaps the most frustrating thing about shipping anything less than a blockbuster game is the lack of feedback you get on your work. The very best games of any given year will be scrutinized and evaluated by the community of developers, but everything else is pretty much ignored.  I was surprised and pleased therefore, when a friend pointed me to an old blog entry by Brian Karis that mentioned the shadows in Fracture.  Brian’s entry is only the fourth piece of feedback I’ve received on the technology behind Fracture, and it is the third piece specifically complimenting the shadows.  I’m particularly pleased to see praise for Fracture’s shadows, because finding just the right technique for them was a long and difficult process.

The first implementation of global shadows in Fracture was a single, orthographic shadow map fit to the view frustum. This was never intended to be the final solution, but it was quick and easy to implement and it provided a good baseline for measuring the value of other techniques.

Fracture was, at that time, spec’d to have draw distances of about a thousand meters, and we’d only budgeted enough memory and fill rate for a single 1024×1024 shadow map. Fracture was also first person initially, and we wanted convincing self-shadowing on the player’s 3-D hands and weapons. To get the kind of shadow resolution we wanted, we’d have needed a 100k by 100k orthographic shadow map or a 10,000 times increase in our shadow budget.

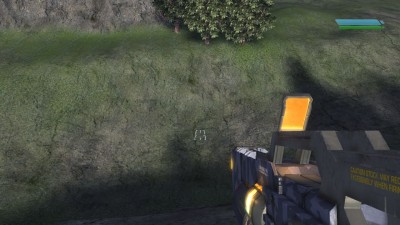
The perspective shadow map at its best.

After the orthographic shadow map, I implemented a form of perspective shadow mapping. Perspective shadow maps distribute resolution non-uniformly across the view frustum by utilizing a perspective projection to warp the shape of the shadow frustum to better fit the view frustum. My implementation of perspective shadow maps was primarily inspired by light-space perspective shadow maps. On the whole I found the perspective shadow map implementation reasonably straightforward, perfectly stable, and very effective at increasing shadow resolution near the player’s camera. With a single 1024×1024 perspective shadow map, the shadows in the immediate vicinity of the player were, in ideal conditions, high enough resolution to provide tolerable coarse shadows on the player’s weapon.

Unfortunately, not all conditions were ideal and there were problems.

Single-pass perspective shadow maps have limited flexibility in how they can redistribute resolution across the view frustum. When the shadow’s light direction is orthogonal to the view direction, the perspective shadow frustum is an almost perfect fit for the view frustum. However, as the shadow direction becomes more aligned with the view direction, perspective shadow maps lose their effectiveness and end up distributing shadow resolution uniformly, just like orthographic shadow maps. Luckily this isn’t as big a problem as it first sounds.

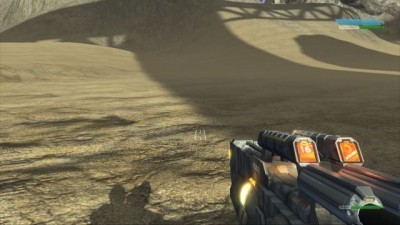
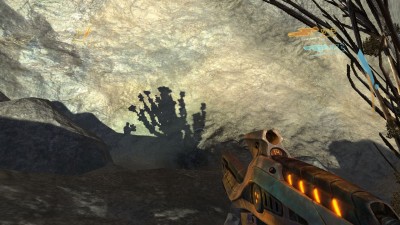
A barely discernable player shadow at a problematic view angle.

When the player camera is looking directly into the light, there aren’t really any visible shadow boundaries. Every visible surface is completely self shadowed, and that effect is handled redundantly by shading and shadowing. When the player is looking directly away from the light, however, he’s generally looking directly at his own shadow and shadow resolution is very important. Luckily there are two common characteristics of game worlds that held true for the prototype levels of Fracture. First, global shadows usually come from above, and second, the player camera is usually situated near the bottom of the world. Given these two constraints, there was an obvious solution to the problem of poor shadow resolution when looking at the player’s feet. Before fitting the shadow frustum to the view frustum, I first clipped the view frustum to the dynamic bounds of the world. When the camera is aligned with the light direction, the shadow frustum dimensions are constrained by the size of the visible camera’s far plane. With the view frustum starting at the player’s head and clipped by the ground just below his feet, the far plane of the view frustum was never more than fifty square meters and even a uniform distribution of resolution was sufficient to provide high quality shadows.

Despite its problems, the single perspective shadow map implementation persisted in Fracture for over a year of development. Unfortunately for me, during that time shadows in competing games continued to improve, and the artists and designers felt more and more constrained by the limitations of perspective shadow maps. The artists wanted to feature dramatic early morning and late afternoon lighting in levels, and the designers wanted to incorporate more vertical gameplay in which the player rained death from above down on enemies fifty meters below. We also had occasional issues in which an errant particle effect or physics object would penetrate the terrain and begin plummeting into the uncharted abyss below, dragging the world bounds and shadow quality along with it. In all of those cases my perspective shadow map implementation was no better than an orthographic shadow map and the shadows deteriorated to little more than dark smudges under large objects.

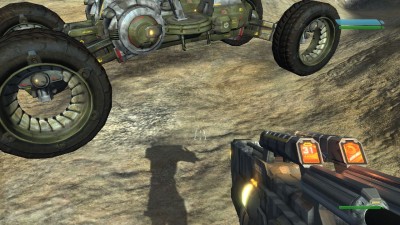
Player shadows were much improved with cascaded PSMs

To address the complaints about the single perspective shadow map approach, my coworker Kyle extended the system to use a cascade of three perspective shadow maps. The cascades were constructed so that each map covered a parallel slice of the view frustum, and the depth of each slice was hand-tuned to optimal effect. The first cascade covered only 4 meters, the next one 100 meters, and the final one fit the entire remaining portion of the view frustum which was still over a thousand meters. Each of the three maps was the same dimensions as the original shadow map, so memory and rendering costs tripled. However, the results were inarguably worth it. In all the cases where the quality of the single perspective shadow map suffered, the cascaded approach maintained high-resolution shadows in the immediate vicinity of the player. Shadows in the mid-distance (the second cascade) also received a moderate bump in resolution compared to the single map approach. Unfortunately shadows in the last cascade weren’t noticeably improved. The costs of this system were quite high, but nevertheless the artists and designers were appeased and development rolled on for another six months.

From the wrong camera angle, the sharp drop in cascade resolution decapitated the player shadow.

After six months with cascaded perspective shadow maps, the development team once again began to have second thoughts. The biggest complaint about the cascaded solution was the boundary between cascades. In problem areas the drop in resolution between the first and second cascades was dramatic. If the player managed to position himself so that the cascade boundary lay across his own shadow, the effect was really unsightly. In some cases the drop in resolution between the shadow of the player’s body and the shadow of the player’s head was so great that the player looked decapitated in his shadow.

From my perspective, there were three additional issues with our shadows. With the expansion to three cascaded shadow maps, shadows were now fantastically over budget. Also, in the middle and far distance where shadow resolution still struggled, the constant shimmering and crawling of the shadows as the camera moved really bothered me. Lastly, the irregularly shaped shadow frustum from the perspective shadow maps made it impossible to get good results from a constant shadow bias. Again in areas where shadow resolution struggled, the shadow bias was unpredictable resulting in inconsistent, but almost always excessive, “peter-panning.”

In the fall of 2007 I embarked on a final rewrite of global shadows for Fracture. To improve performance, I replaced the three independent shadow maps in the cascaded solution with three square regions allocated out of a single texture. I then replaced the shader code for sampling the three shadow maps with a new shader that calculated the UVs appropriate to the desired cascade and only performed a single (filtered) sample from the map. What I had learned from our experience with cascaded shadow maps was that fitting the view frustum with multiple shadow frusta is a far more effective way of increasing shadow map resolution than trying to warp a single shadow map.

Since the performance of my new shader scaled very gracefully with the number of shadow maps, I was able to simultaneously increase the effective shadow map resolution and decrease runtime performance and memory costs by increasing the number of cascades to five. The three 1024×1024 shadow maps were replaced with five 640×640 regions in a single map.

More cascades easily compensated for the switch to uniform shadow maps.

As the number of cascades increased, the value of the perspective transformation in the shadow frusta decreased. Meanwhile I was still frustrated with the shimmering and inconsistent shadow bias associated with perspective shadow maps. I finally made the difficult decision to abandon the perspective shadow map and use traditional orthographic projections for the cascades. This created a few new optimization opportunities in the shader, but more importantly it allowed me to make the shadows from static objects completely stable despite a moving camera and dynamic world bounds. I fit the orthographic shadow frusta to the cascading slices of the view frustum, but I required that the shadow frusta be world axis aligned and I quantized their positions so that as a shadow map moved through the world, its pixel centers always landed in the same place. I also had to quantize the shadow frusta’s near and far planes, though in a much coarser fashion, to ensure consistent depth for an object in the shadow map. This was necessary to guarantee 100% stability in the shadow map when using floating point depth formats.

An aligned cascade boundary, highlighted in red, cuts at odd angles across the view frustum.

Interestingly, clearing the shadows of shimmering and crawling created a new problem that I had to deal with. The uniform distribution of resolution within a cascade and the perfectly stable static shadows made the transitions between cascades really obvious. Whereas previously the general instability of the shadows helped hide the cascade boundaries sliding through the world, now there was a very clear resolution boundary. The fact that the cascades were aligned to the world axes and not the view direction contributed to this problem as well. I always sampled shadows from the highest resolution map available, which meant the cascade boundaries shifted depending on the orientation of the camera. When the camera was looking diagonally between two world axes, the cascade boundaries were at corners of the shadow maps rather than straight edges.

I was 50% over our original budget for shadows, but the new approach was half the cost of what we’d been living with for six months so I felt justified in sacrificing a bit more performance. I expanded each cascade slightly to create an overlap, and I extended the shader to blend between two cascades at the boundaries. On platforms with good pixel shader dynamic branching this only increased costs by about 15%. On less capable platforms the dynamic branching was omitted and the cost of applying shadows grew by 40% to twice our original budget. I also introduced a maximum range for the lowest resolution cascade at this point and faded shadows away completely beyond that distance. This fit conveniently within the blending code I’d already added to the shader, and it saved us from wasting shadow resolution on the rarely visible back half of a 1500 meter view frustum. As I recall, Fracture shipped with between a 250 and 350 meter shadow range depending on the level.

I also at this time pursued an avenue that turned out not to be fruitful. Much of the cost of applying the cascaded shadow maps came from the filtering I was doing in the shader. I was using an 8 tap, Poisson disk filter, which I felt was the best compromise between cost and quality. I decided to try out variance shadow maps instead. I have seen benefits from variance shadow maps in some situations, but in the case of global cascaded shadows the technique didn’t pan out. Variance shadow maps are more expensive to create because they generally can’t take advantage of depth-only rendering, and they either suffer from precision artifacts or they require more memory. They also incur a cost in prefiltering. All of these costs are expected to be made up for by significantly more efficient application of the shadow maps. In my case this simply wasn’t true. Even the best global shadow maps have pretty poor pixel coverage, so fully prefiltering the variance shadow maps is wasteful. I tried several approaches to optimize the variance shadow map technique, but in the end the performance was only equal to my non-variance implementation and the artifacts from the variance approach outweighed the improved softness of the shadows.

The last change I made for Fracture’s shadows was to replace the manually specified transition and cascade sizes with ones automatically computed to preserve constant screen-space shadow resolution between cascades. For any given scene I found that hand-tuned values could produce slightly more appealing results, but since we had many varying FOVs and shadow ranges, I didn’t feel justified in forcing the artists to manually specify every value.

One of the fun things about the work I put into the shadows in Fracture is that very few of the techniques I experimented with were mutually exclusive. I was able to, at one point, run through our levels toggling the shadows from perspective to orthographic, variance to non-variance, PCF to Poisson disk, and simultaneously varying the number, size, and resolution of the cascades. I also implemented debug visualization modes to show the outline of shadow texels in the world rather than the shadows themselves. Doing this, the value and cost of the various techniques became rapidly apparent. Perspective shadow maps were great, but I could always get better quality and lower costs by increasing the number of cascades. Prefiltering with variance shadow maps was great, but a fairly expensive filter during sampling was better looking for the same cost. The optimal number and size of cascades actually varied slightly depending on the target platform. Although I said we used five cascades at 640×640, that was only on the Xbox 360. On the PS3 the sweet spot for performance turned out to be distributing slightly more memory across three higher-resolution cascades.

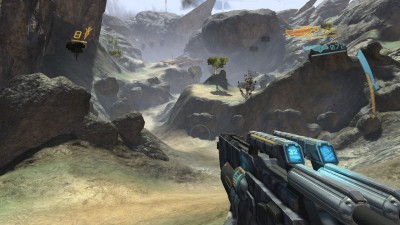
The uniform shadow maps provided plenty of resolution even in worst-case scenarios.

That pretty much covers the implementation of global shadows that Fracture shipped with. It survived about two years with few complaints and reasonable performance. Since Fracture I’ve made a few more improvements, though mostly in the realm of optimizations. The most valuable optimization, and the only one I’ll mention here, was culling the contents of each cascade more aggressively. Although each cascade must be an orthogonal frustum from the perspective of the GPU, a much smaller volume can be defined on the CPU that covers all the shadow casters relevant to a particular map. The volume I use for culling each map is constructed by finding the intersection of the view frustum extruded in the direction of the light and the original orthogonal shadow frustum and then subtracting the volume of all the higher resolution maps. The result isn’t a convex shape, but it can be decomposed into an inclusive and an exclusive convex volume for fast object intersection queries.

In real-world data, more aggressive culling of the cascades reduced the number of objects rendered into the global shadow map by between 30 and 75 percent depending on the orientation of the camera relative to the light. The nice thing about this reduction is that it starts at the object level and consequently translates directly into CPU and GPU savings.

I’m pretty confident now that I won’t be revisiting global shadows again in this hardware generation.  I’m completely satisfied with both the cost and the quality of our current solution, and I don’t feel there is much improvement to be had without introducing a new computation model.  With any luck, the next time I’m thinking about global shadows it will be in the context of compute shaders and perhaps even non-rasterization based techniques.

Symbol Sort : A Utility for Measuring C++ Code Bloat

OVERVIEW

SymbolSort is a utility for analyzing code bloat in C++ applications.  It works by extracting the symbols from a dump generated by the Microsoft DumpBin utility or by reading a PDB file.  It processes the symbols it extracts and generates lists sorted by a number of different criteria.  You can read more about the motivation behind SymbolSort here.

The lists compiled by SymbolSort are:

Raw Symbols, sorted by size

This list is generated from the complete set of symbols.  No deduplication is performed so this list is intended to highlight individual large symbols.

File contributions, sorted by size

This list is generated by calculating the total size of symbols that contribute to a folder path.  If the input is a COMDAT dump, the source location for symbols is the .obj or .lib file that DumpBin was run on (see usage for details).  It is important to note that for COMDAT dumps individual symbols will appear multiple times coming from different .obj files.  If the input is a PDB file, the source location for symbols is the actual source file in which the symbol is defined.  The source file for data symbols is not always clearly defined within the PDB so in some cases it is a best guess.

File contribution, sorted by path

This is a complete, hierarchical list of the size of symbols in all contributing source files.

Symbol Sections / Types, sorted by total size and by total count

This shows a breakdown of symbols by section or type, depending on the kind of information that can be extracted from the input source.

Merged Duplicate Symbols, sorted by total size and by total count

This list is generated by merging symbols with identical names.  The symbols are not guaranteed to be the same symbol.  In the case of PDB input there will be very few duplicate symbols.  COMDAT input, however, should contain a large number of duplicate symbols.  This list is useful for measuring total compile and link time for a particular symbol.  A relatively small symbol that appears in a very large number of .obj files will have a large total size and appear near the top of this list.

Merged Template Symbols, sorted by total size and by total count

This list is generated by stripping template parameters from symbols and then merging duplicates.  Symbols std::auto_ptr<int> and std::auto_ptr<float> will be transformed into std::auto_ptr<T> in this list and be counted together.

Merged Overloaded Symbols, sorted by total size and by total count

This list is generated by stripping template parameters and function parameters from symbols and then merging duplicates.  Overloaded functions sqrt(float) and sqrt(double) will be transformed into sqrt(…) in this list and be counted together.

Symbol Tags, sorted by total size and by total count

This list represents a tag cloud generated from the symbol names.  The symbols are tokenized and the total size and count is tallied for each token.  I’m not sure what this list is good for, but I’m all about tag clouds so I couldn’t resist including it.

USAGE

SymbolSort [options]

Options:
  -in[:type] filename
      Specify an input file with optional type.  Exe and PDB files are
      identified automatically by extension.  Otherwise type may be:
          comdat - the format produced by DumpBin /headers
          sysv   - the format produced by nm --format=sysv
          bsd    - the format produced by nm --format=bsd --print-size

  -out filename
      Write output to specified file instead of stdout

  -count num_symbols
      Limit the number of symbols displayed to num_symbols

  -exclude substring
      Exclude symbols that contain the specified substring

  -diff:[type] filename
      Use this file as a basis for generating a differences report.
      See -in option for valid types.

  -searchpath path
      Specify the symbol search path when loading an exe

  -path_replace regex_match regex_replace
      Specify a regular expression search/replace for symbol paths.
      Multiple path_replace sequences can be specified for a single
      run.  The match term is escaped but the replace term is not.
      For example: -path_replace d:\\SDK_v1 c:\SDK -path_replace
      d:\\SDK_v2 c:\SDK

  -complete
      Include a complete listing of all symbols sorted by address.

Options specific to Exe and PDB inputs:
  -include_public_symbols
      Include 'public symbols' from PDB inputs.  Many symbols in the
      PDB are listed redundantly as 'public symbols.'  These symbols
      provide a slightly different view of the PDB as they are named
      more descriptively and usually include padding for alignment
      in their sizes.

  -keep_redundant_symbols
      Normally symbols are processed to remove redundancies.  Partially
      overlapped symbols are adjusted so that their sizes aren't over
      reported and completely overlapped symbols are discarded
      completely.  This option preserves all symbols and their reported
      sizes

  -include_sections_as_symbols
      Attempt to extract entire sections and treat them as individual
      symbols.  This can be useful when mapping sections of an
      executable that don't otherwise contain symbols (such as .pdata).

  -include_unmapped_addresses
      Insert fake symbols representing any unmapped addresses in the
      PDB.  This option can highlight sections of the executable that
      aren't directly attributable to symbols.  In the complete view
      this will also highlight space lost due to alignment padding.

SymbolSort supports three types of input files:

COMDAT dump

A COMDAT dump is generated using the DumpBin utility with the /headers option.  DumpBin is included with the Microsoft compiler toolchain. SymbolSort can accept the dump from a single .lib or .obj file, but the best way to use it is to create a complete dump of all the .obj files from an entire application.  The Windows command line utility FOR can be used for this:

for /R "c:\obj_file_location" %n in (*.obj) do "C:\Program Files (x86)\Microsoft Visual Studio 10.0\VC\bin\DumpBin.exe" /headers "%n" >> c:\comdat_dump.txt

This will generate a concatenated dump of all the headers in all the .obj files in c:\obj_file_location.  Beware, for large applications this could produce a multi-gigabyte file.

PDB or EXE

SymbolSort supports reading debug symbol information from .exe files and .pdb files.  The .exe file will only be used to find the location of its matching .pdb file, and then the symbols will be extracted from the PDB.  SymbolSort uses msdia100.dll to extract data from the PDB file.  Msdia100.dll is included with the Microsoft compiler toolchain.  In order to use it you will probably have to register the dll.

regsvr32 "C:\Program Files\Common Files\Microsoft Shared\VC\msdia100.dll"

It is important that you register the 64-bit version of msdia100.dll on 64-bit Windows and the 32-bit version on 32-bit Windows.  If you don’t find msdia100.dll in the path listed above, try looking for it in the Visual Studio install directory under “\Microsoft Visual Studio 10.0\DIA SDK\bin\”

NM dump

Similar to the COMDAT dump, SymbolSort can accept symbol dumps from the unix utility nm.  The symbols can be extracted from .obj files or entire .elfs.  SymbolSort supports bsd and sysv format dumps.  Sysv is preferred because it contains more information.  The recommended nm command lines are:

nm --format=sysv --demangle --line-numbers input_file.elf
nm --format=bsd --demangle --line-numbers --print-size input_file.elf

DOWNLOAD

SymbolSort-1.2.zip

BUILDING

The source for SymbolSort is distributed as a single file, SymbolSort.cs.  It can be built as a simple C# command line utility.  In order to get the msdia100 interop to work you must add msdia100.dll as a reference to the C# project.  That is done either by dragging and dropping the dll onto the references folder in the C# project or by right clicking the references folder, selecting “Add Reference” and then browsing for the msdia100 dll.

REVISION HISTORY

1.2    + Upgraded to Visual Studio 2010 / msdia100.dll
       + Added -path_replace option to convert paths stored in PDBs.
       + Added -complete option to dump a full list of all symbols sorted by 
         address.
       + Added several options for controlling what symbols are included in PDB
         dumps since PDBs often list the same address redundantly under
         different labels.
1.1    + Added support for computing differences between multiple input sources
       + Added support for nm output for PS3 / unix platforms.
       + Changed command line parameters.  See usage for details.
       + Added section / type information to output.
1.0    + First release!

FUTURE WORK (to be done by someone else!)

  • Add a GUI frontend to allow interactive filtering and sorting.
  • Read both the PDB and the COMDAT dump simultaneously and cross-reference the two.  This would enable new kinds of analysis and richer dumps.
  • Produce additional merged symbol reports by merging all symbols from the same class or namespace or that match based on some more clever fuzzy comparison.
  • Improve relative -> absolute path conversion for nm inputs
  • Figure out how to extract string literal information from PDB.

Minimizing Code Bloat: Redundant Template Instantiation

This article is a continuation of Minimizing Code Bloat for Faster Builds and Smaller Executables.

The last item on my list of code bloat causes is redundant template instantiation.  Template functions have a lot in common with inline functions.  Like inline functions, template functions are instantiated into the object file of every translation unit in which they are used.  Also like inline functions, template functions generate weak symbols which are merged silently by the linker.  Redundant template instantiations won’t increase your executable size, but they can contribute significantly to your build times.

Consider a commonly used class like std::string.  The std::string class is actually a template class defined as:

typedef basic_string<char, char_traits<char>, allocator<char> > string;

In an engine that uses std::strings, some members like std::string::assign may be referenced in nearly every translation unit.  Even engines that eschew the use of std::string may unknowingly be instantiating a lot of std::string code because it is so pervasive in the standard library.  Looking at a symbol dump from one version of Despair Engine, I see over 1600 instances of dozens of functions from std::string.  That’s right, in every full build we compile most of std::string 1600 times, optimize the code 1600 times, write it into .obj files 1600 times, copy it into .lib files 1600 times, read it into the linker 1600 times, and then throw 1599 identical copies away!  All told I think it is less than 10 megabytes of code and accounts for only a couple percent of our build times, but still, it’s a lot to pay for a wrapper around a char*.

Don’t think that these sorts of problems are confined to the standard library.  Any template class that is widely used can produce a lot of code bloat from redundant instantiations.  The question is, what do you do about it?

One option is to convert template code into non template code.  If you never instantiate basic_string with anything other than a single set of parameters, is it really worth being a template class?  The same question could be asked of a templatized math library.  Does matrix<T> need to be a template class when all you ever use is matrix<float>?

Although removing template code is always an option, it isn’t always a good one.  Template code may be expensive, but it is also really handy.  If you have a templatized math library, chances are that while 99% of the instantiations are matrix<float>, somewhere in your engine or tools you have an instantiation of matrix<double>.  Similarly, amid all those instantiations of basic_string<char>, maybe there’s a basic_string<wchar_t> or two hanging out.

Luckily there is a way to prevent redundant template instantiations without changing the code.  That is through the use of explicit template instantiation declarations.  Explicit instantiation declarations aren’t technically part of the C++ standard, but they’re supported by MSVC and gcc and they’re included in the C++09 draft standard, so they’re a safe bet to use.  What explicit instantiation declarations do is allow you to prevent the compiler from instantiating a particular template in the current translation unit.  They look just like explicit instantiation definitions, but they’re preceded by the extern keyword.  For example, the explicit instantiation declaration of basic_string<char> looks like this:

extern template class basic_string<char>;

You can add this declaration to a root header in your application and rebuild, and, unless you’ve missed a translation unit, you’ll encounter linker errors for missing basic_string<char> symbols.  Once you’ve removed all the basic_string<char> instantiations from your engine, the next thing to do is to add one back so the linker has all the code it needs to put together a complete executable.  That’s where explicit instantiation definitions come in.

Explicit instantiation definitions are the counterpart to explicit instantiation declarations.  They tell the compiler to fully instantiate a particular template even if it is otherwise unused in the current translation unit.  Here’s an example of how you can use the two concepts together to prevent redundant instantiations of basic_string.

// in string_instantiation.h
#ifdef DS_EXTERN_TEMPLATE_INSTANTIATION
namespace std
{
    extern template class basic_string<char>;
}
#endif

// in string_instantiation.cpp
#ifdef DS_EXTERN_TEMPLATE_INSTANTIATION
#undef DS_EXTERN_TEMPLATE_INSTANTIATION

#include "string_instantiation.h"

namespace std
{
    template class basic_string<char>
}
#endif // DS_EXTERN_TEMPLATE_INSTANTIATION

The DS_EXTERN_TEMPLATE_INSTANTIATION #define in the above code serves two purposes.  First it allows us to disable explicit template instantiation for compilers that don’t support it, and second it allows us to work around a common bug in compilers that do support it.  Although the standard states that an explicit instantiation definition may follow an explicit instantiation declaration within a translation unit, many compilers don’t like it and won’t allow an explicit instantiation definition to override a preceding explicit instantiation declaration.

There is one dark fact about explicit template instantiation that you should know before applying it in your own codebase.  Although explicit template instantiation effectively turns template code into non template code from the perspective of code bloat, it doesn’t really help much with classes like std::string.  The syntax for out-of-line template class function definitions is so cumbersome that many programmers prefer to implement all their template class members entirely within the class declaration.  That’s what has happened with Microsoft’s STL implementation.  Unfortunately what that does is implicitly make every member function in a template class an inline function.  Of course most of the member functions are so large that they’ll never be inlined, but it doesn’t matter from the perspective of the compiler.

The explicit template declaration of basic_string<char> prevents the compiler from instantiating its members as template functions, but it doesn’t prevent it from instantiating them as inline functions!  The basic_string class goes from a classic example of code bloat due to redundant template instantiation to a classic example of code bloat due to incorrect inlining!  You can’t win!

In your own code, at least, you can fix the incorrect inlining problem right after you fix the redundant instantiation problem.  Just move the template class member functions out of line and they’ll disappear from your symbol dumps.

And that’s everything I know about code bloat in a voluminous 6 part series.  Perhaps what I should be writing about is blog bloat.  All that’s left is to post some code.

Minimizing Code Bloat: Incorrect Inlining

This article is a continuation of Minimizing Code Bloat for Faster Builds and Smaller Executables.

Earlier I talked about excessive inlining as a common cause of code bloat.  Excessive inlining is when code that shouldn’t be inlined is.  Today I’m going to look at a related problem, code that is declared as inlined but never will be.

Any function whose address is taken for storage in a function pointer or a virtual function table can never fully be inlined.  Even for a function that can legally be inlined, the compiler has ultimate authority over whether or not it will be.  If a function is large the compiler will generally forgo inlining it because the performance benefits of removing the function call overhead don’t justify the increase in executable size.  That’s all well and good, but it still poses a problem.

C++ compilers work by dividing programs into something called translation units.  A translation unit is a single cpp file and all the headers it includes.  The compiler turns these translation units into object files and ultimately the linker combines the contents of all the object files into an executable.  The important thing to note is that every function visible to the compiler in a translation unit must be compiled as part of that unit.  In the case of a function that is declared inline, the compiler will generate a compiled instantiation of the function in every cpp file that uses it.  The various redundant instantiations are marked as weak symbols so the linker knows that multiple copies are expected and that it can pick any one of them for use in the final executable.

Knowing this, you can see how wasteful functions that are incorrectly marked as inline can be.  Large functions are less likely to be inlined, are more likely to take a long time to compile, and consequently can be murder on your build times.

By this point you should have a pretty good idea of how to detect incorrect inlining.  The same technique I proposed for measuring excessive inlining and the compile-time cost of template overspecialization works equally well for detecting incorrect inlining.  Dump the symbols from all your object files with DumpBin /headers and look for large functions with lots of redundant instantiations.

One of the most interesting (and insidious!) sources of incorrect inlining is code that you don’t write at all.  Consider this apparently harmless class definition:

class DataBox
{
    PhysicsData     m_physics;
    AIData          m_ai;
    GraphicsData    m_graphics;
    AnimationData   m_animation;
    UIData          m_ui;
    ScriptData      m_script;
    NetworkData     m_network;
};

This class is potentially a major contributor to code bloat from incorrect inlining.  If you’re scratching your head and wondering how a class with no functions can contribute to code bloat, take a look at the next listing to see this class the way the compiler sees it.

class DataBox
{
    PhysicsData     m_physics;
    AIData          m_ai;
    GraphicsData    m_graphics;
    AnimationData   m_animation;
    UIData          m_ui;
    ScriptData      m_script;
    NetworkData     m_network;

    // Not legal C++.  This is for illustration purposes only.
    DataBox()
    {
        m_physics.PhysicsData();
        m_ai.AIData();
        m_graphics.GraphicsData();
        m_animation.AnimationData();
        m_ui.UIData();
        m_script.ScriptData();
        m_network.NetworkData();
    }

    ~DataBox()
    {
        m_network.~NetworkData();
        m_script.~ScriptData();
        m_ui.~UIData();
        m_animation.~AnimationData();
        m_graphics.~GraphicsData();
        m_ai.~AIData();
        m_physics.~PhysicsData();
    }
};

In C++ every class has a constructor, a destructor, a copy constructor, and an assignment operator.  If you don’t provide these functions the compiler will, and it must do so inline.  Of course good compilers will only instantiate inline functions when they are actually used, so most classes never have their default copy constructor or assignment operators generated, but unless you’re doing something dangerously clever in your codebase, every class has a destructor instantiated at least once.

If you notice default (also sometimes called automatic) methods showing up in the top slots of your redundant function hotlist, the fix is counterintuitive but also really simple.  Just provide an empty, non-inline implementation in place of the default one.  Providing empty, non-inline implementations of default methods for nontrivial classes can sometimes help your build times in other ways.  If you use a lot of smart pointers in your code, the default destructor of a class holding smart pointers may be the only thing preventing you from replacing the #includes of the headers for the classes stored in smart pointers with forward declarations of those classes.  In other words, inline functions create header dependencies, and inline default methods are no exception.

Speaking of smart pointers, as great as they are, code bloat is one of their unfortunate costs.  As I mentioned above, good compilers only instantiate inline code when it is actually used.  Reference counting smart pointers allow for distributed ownership of objects, which can be a powerful and convenient design freedom.  However, if responsibility for destroying objects is widely distributed through your code, so is responsibility for instantiating object destructors.  An engine with rigorously defined ownership hierarchies will have few inline destructor instantiations whereas an engine with sloppily defined ownership hierarchies will have many.  So if you use smart pointers, use them responsibly!  Pass by reference and reference count only when necessary.  Unnecessary reference counting isn’t just inefficient at run time, it is inefficient at compile time too!

If all this sounds like a major pain in the neck, I suggest you give up now and implement unity builds.  They circumvent all these redundant instantiation issues so they’re fantastic at optimizing build times in codebases with poor structure.  On the other hand, if you’re still enjoying this trek through compile land, join me next time for a discussion of redundant template instantiation.

Minimizing Code Bloat: Static Allocations

This article is a continuation of Minimizing Code Bloat for Faster Builds and Smaller Executables.

Static allocations are certainly the simplest and most predictable sources of code bloat.  Static allocations refer to data structures in a program for which storage is allocated for the entire duration of the application’s execution.   In C++ file, class, and local static variables all require static allocations.  Additional examples of static allocations in C++ are global variables, string literals, and virtual function tables.

Static allocations can be very useful in some circumstances, but they can also be very wasteful.  Most of the code in an engine is executed very infrequently, which means most of the static allocations supporting that code are rarely needed.  Unfortunately since static allocations exist for the lifetime of the program, they’re taking up memory whether you’re using them or not.

In addition to possibly wasting memory, static allocations can increase program link and load times.  The memory for most static allocations is reserved directly within the application binary.  Consequently, every megabyte of static allocation is a megabyte that must be written to disk every time you link, copied across the network every time you deploy, and read from disk every time you launch.

The one exception to this is a special kind of static allocation known as bss data.  Static allocations that are known at compile time to be zero-initialized are placed in a special section of the executable called the bss section.  Memory used by objects in the bss section isn’t reserved in the executable, instead it is allocated by the program loader.  Bss data doesn’t significantly impact build times, but it has the same run time memory requirements as other static allocations.

In the list of code bloat causes, static allocations are usually a very distant third, but every engine I’ve investigated for static allocations has yielded a few unpleasant surprises.

Dumpbin isn’t of much help when it comes to tracking static allocations.  Data symbols aren’t packaged as COMDATs, so they don’t show up in the /headers report I’m so fond of.   To gather statistics on the static allocations within your application, you’ll have to crack open the PDB.  Every static and global variable is documented in the program database along with its size and, through some creative cross-referencing, its source file.

Large static objects are easy to find–just sort the data symbols by size and gawk at the top offenders. Don’t stop there though.  If you generate a lot of code with templates or macros, you may have large numbers of relatively small static objects.  To quantify the cost of these objects you’ll need to do some pattern matching on symbol names. You can strip template parameters from symbols so MyClass<int>::s_buffer and MyClass<float>::s_buffer get counted together in the stats, or you can strip away the scope entirely and tally the stats for all statics named s_buffer together.  I find it useful to analyze the results from collapsing symbol names in a variety of different ways.  Which option yields the best results depends on the particular codebase I’m dealing with and the type of code generation it uses.

That covers it for static allocations and for executable size optimizations in general.  I still have a couple topics to go, but from now on they’re relevant to build times alone.  Coming up, incorrect inlining.